Revisiting EcoInfra
Preramble: A year or two ago, I started a project called EcoInfra, a IaC CLI tool to help developers understand the carbon footprint of their infrastructure. I wanted to revisit this project and see how I can modernise it and release it.
The EcoInfra Logo
Introduction
EcoInfra is primarily Terraform CLI tool that helps developers understand the carbon footprint of their infrastructure before the emissions reach the air. It was a project I started a few years ago, but I never got around to finishing it due to a few reasons I'll dive into. Now, I want to revisit it and see how I can modernise it and release it.
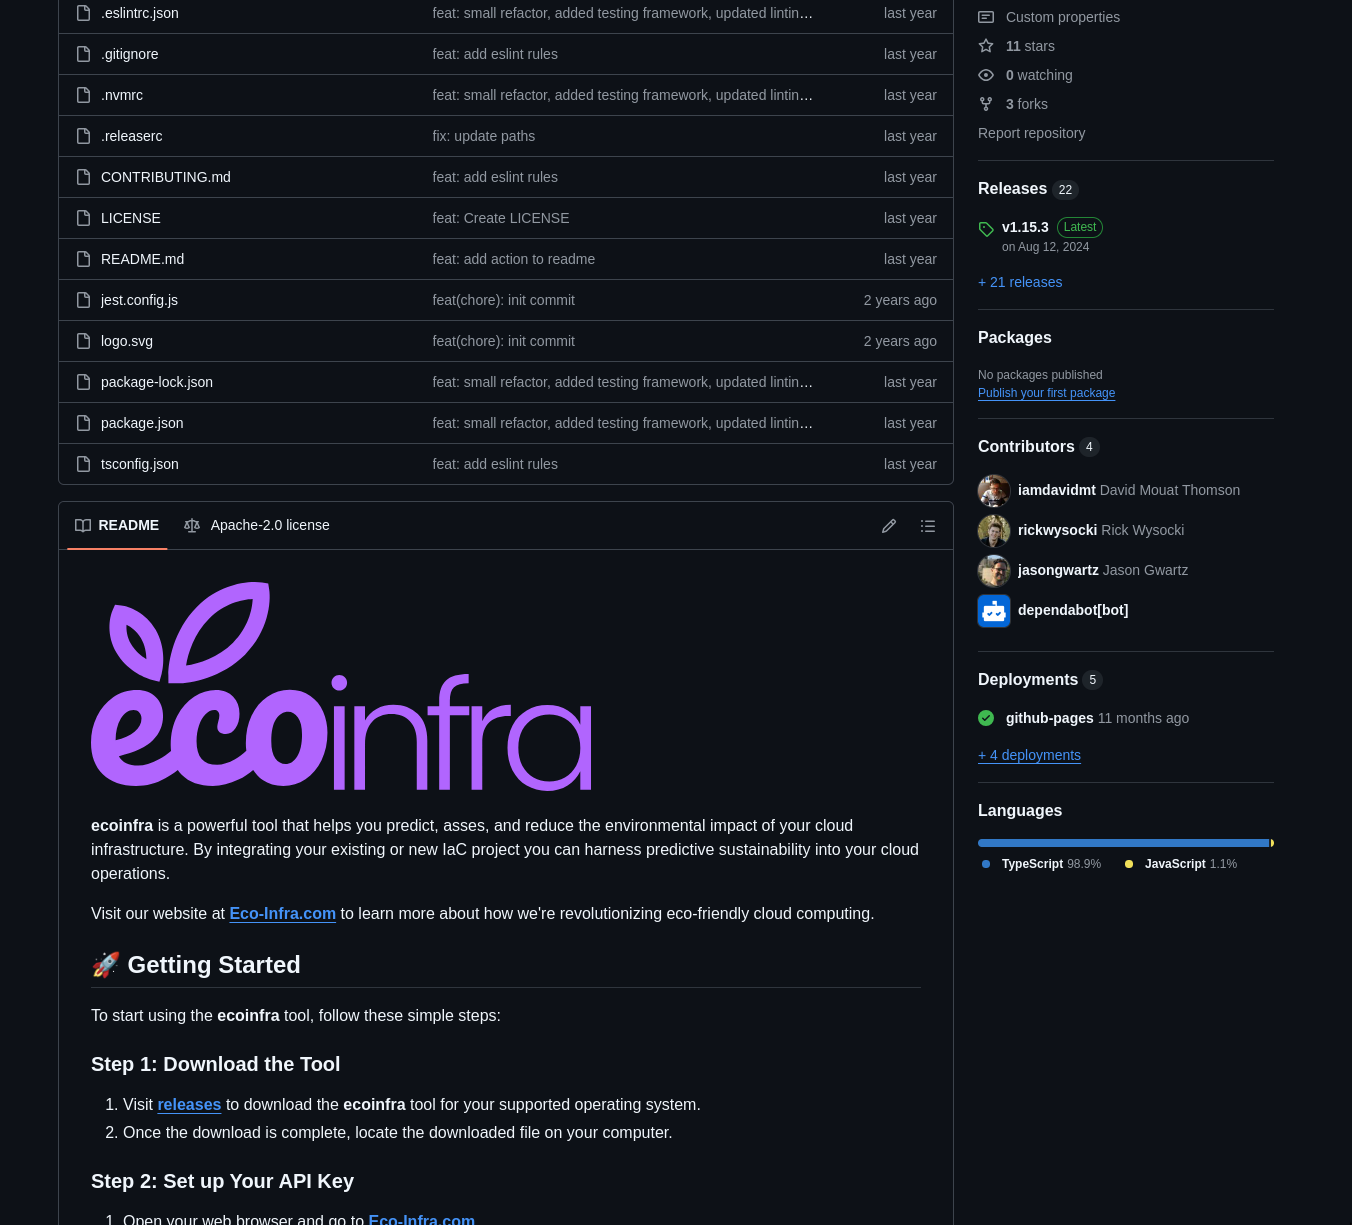
Image of the EcoInfra GitHub page
Taking stock of what I have
I have a few things to consider before I start working on EcoInfra again, let me list them out.
Services.
A few lambdas behind an API Gateway that is used for calculating the users emissions based on their terraform configuration and for handling the two ways of authorizing.
CLI Tool
The CLI tool is written in typescript and communicates with the API's once it has recursively parsed the users terraform configuration.
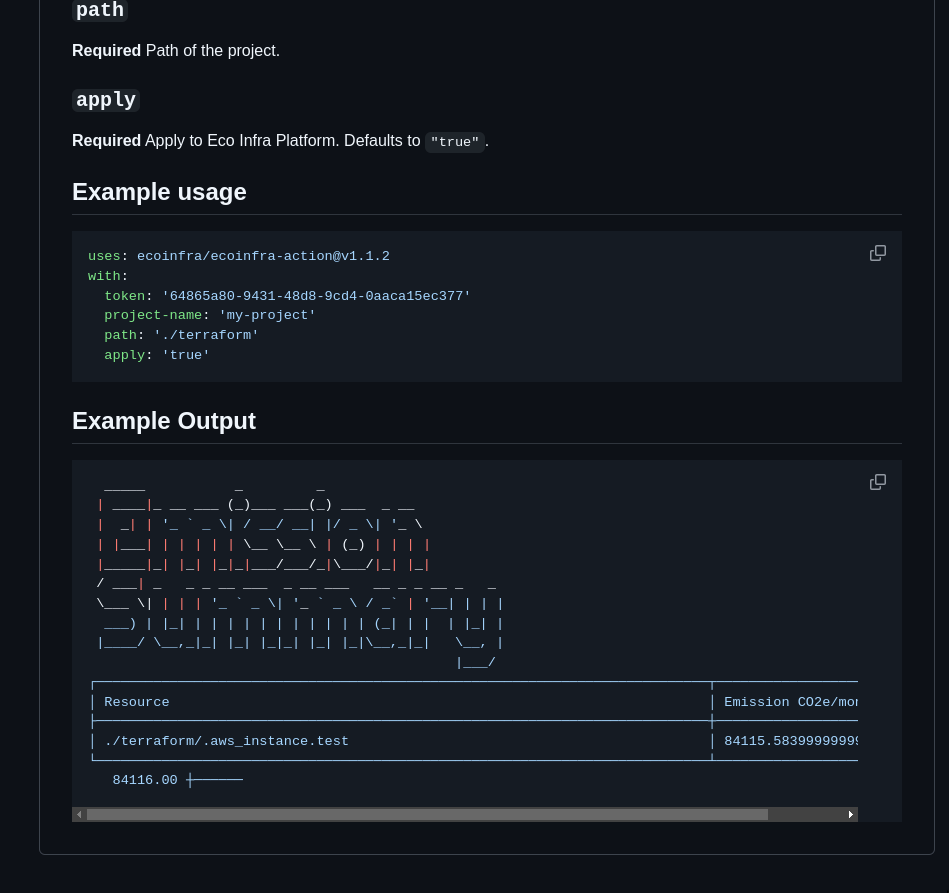
GitHub Action
A GitHub Action that uses the CLI tool on the users terraform configuration and post the results to the users' dashboard. EcoInfra Action
Data
LCA data is stored in a DynamoDB table that is used to calculate the emissions based on the users terraform configuration. This LCA data is generated via a serverless based pipeline that takes into account Scope 1, 2, and 3 emissions. Specifically I have a large dataset of hardware and location based datacenters.
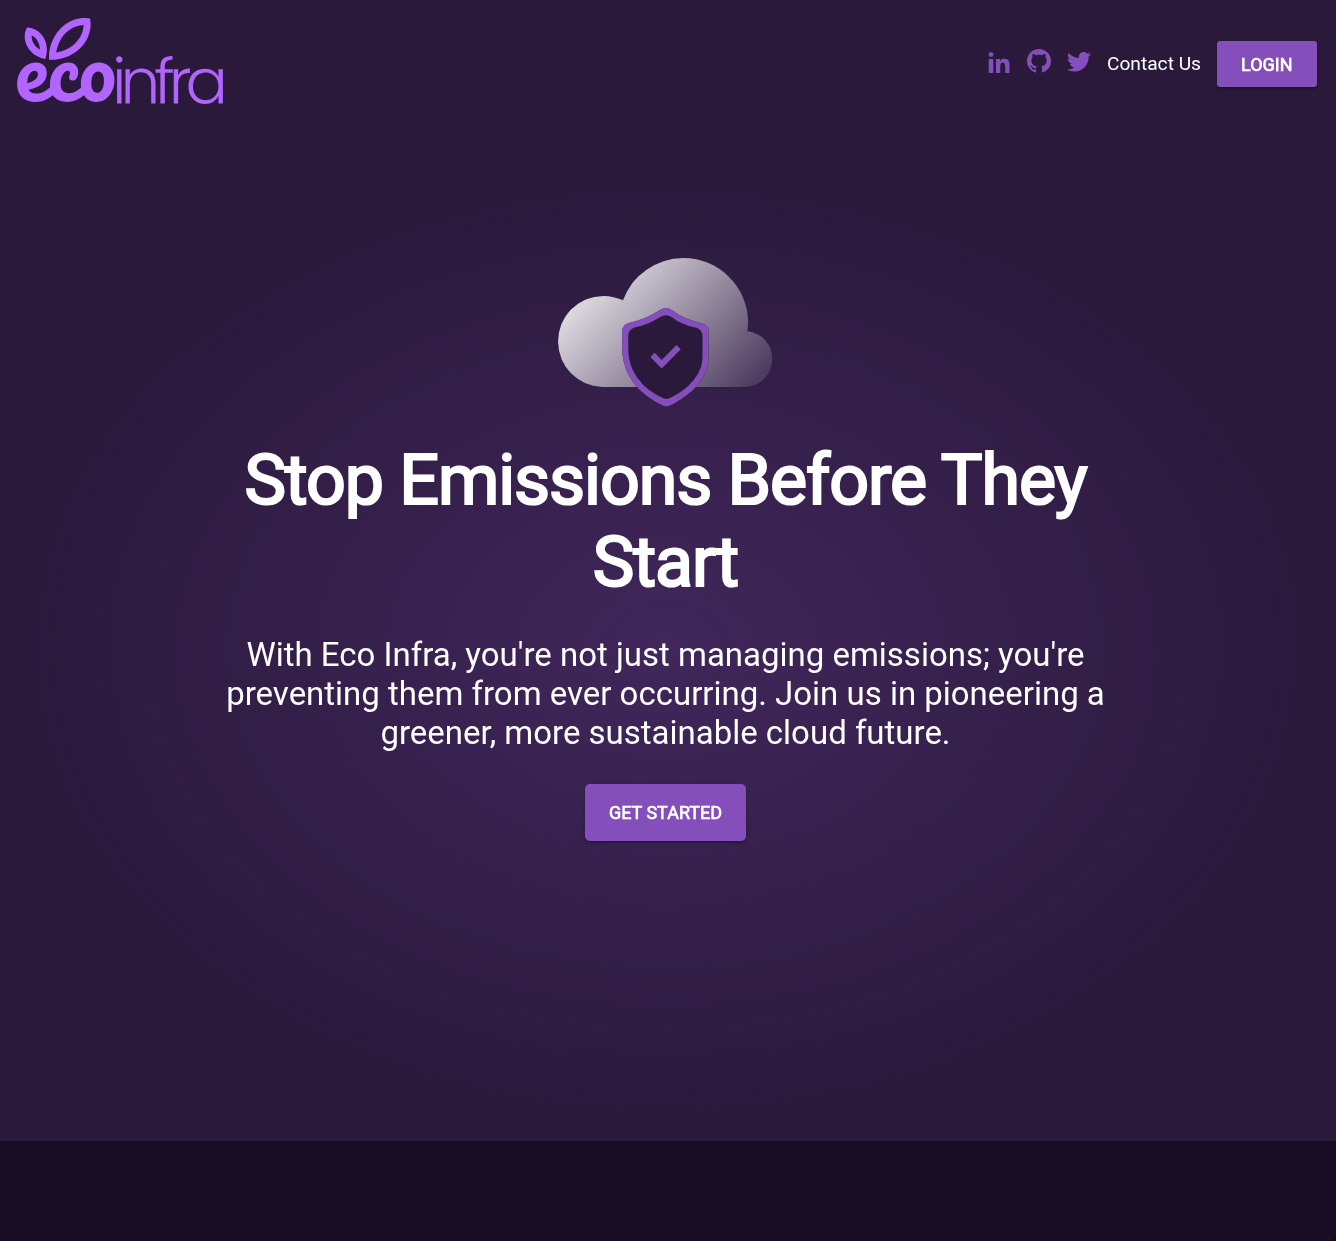
The Website - https://eco-infra.com
The website is a simple static site that explains what EcoInfra is and how to use it.
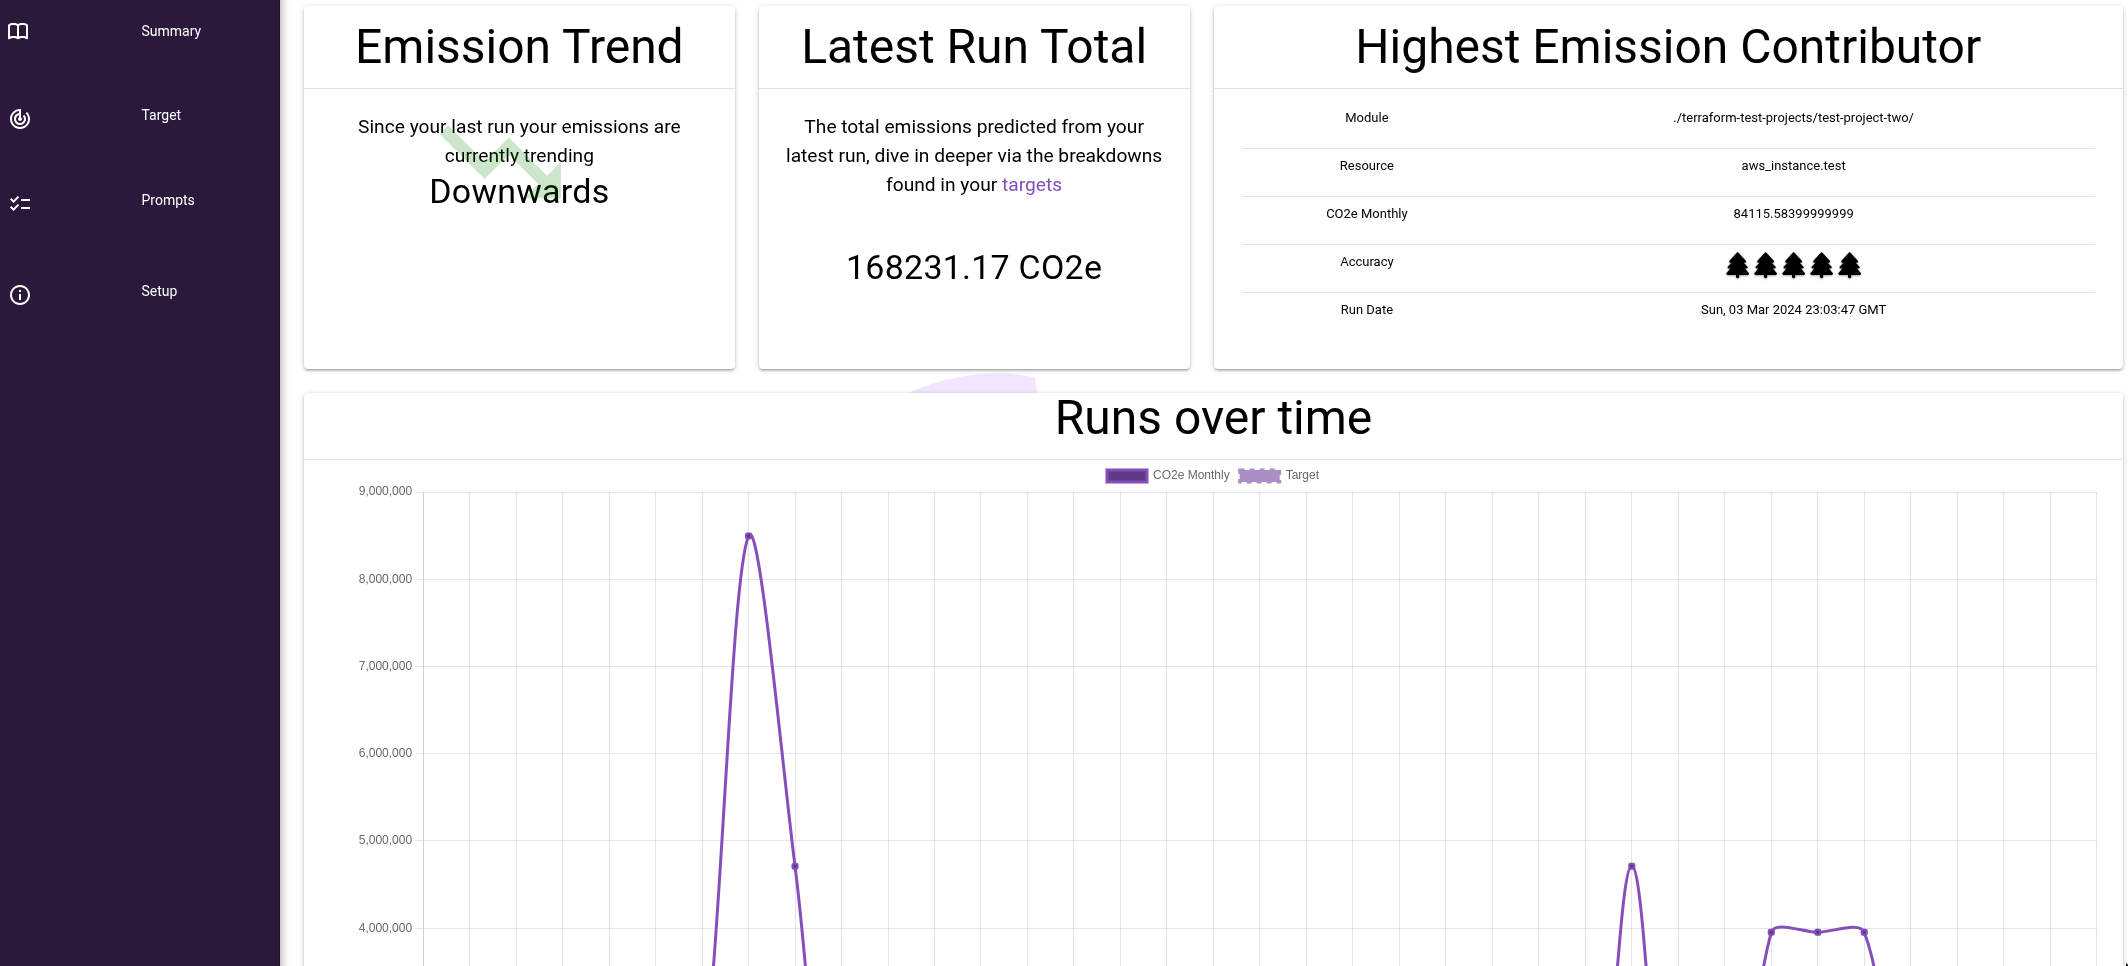
The Dashboard
Another website that is behind authorization that graphs the users emissions and allows them to see their historical emissions and compare them to previous years via a target setting feature. In summary is a simple dashboard that uses a few charts to display the data. Oh and this is where the CLI tool authorization setup lives.
The High Level Architecture
Given all the above components lets map them together to build a better picture of the current EcoInfra landscape.
%%is-centered
graph TD
    A[User] --> B[Website]
    A --> C[Dashboard]
    A --> D[CLI Tool]
    D --> E[API Gateway]
    C --> E
    E --> F[Authorization Service]
    E ---> G[Emissions Calculation Service]
    G --> H[(Mapped Data)]
    I[Ingestion Pipeline] --> H
    S3[(LCA Data)]--> I
Relatively speaking - It's a simple and cost effect architecture, so lets dive into the issues that exist.
Issues with the Current Setup
There are two main areas that I want to focus on when revisiting EcoInfra: the CLI tool and the dashboard. Both of these components have issues that need to be addressed to release EcoInfra. They are:
CLI Tool
The biggest and most obvious - the CLI tool is not user-friendly. It requires users to have a certain level of technical knowledge to use it effectively. The installation process is cumbersome, and the commands are not intuitive, but the biggest issue is the fact that we consume the entire terraform project - I want to move this to only consume the plan output.
The Dashboard
The dashboard is the second-biggest issue - It was built very quickly with a few simple goals in mind which in turn led to a prototype that isn't very user-friendly. The charts are not interactive, and the data is not presented in a way that is easy to understand. The authorization setup is not focusing on best security practices as it's just an API key.
Plan of attack
The plan is to modernise the EcoInfra project by addressing the issues with the CLI tool and the dashboard. The goal is to make it more user-friendly, efficient, and secure. Here are the steps I plan to take:
Update the CLI Tool & API
The first step is to update the CLI tool and API - The CLI Tool will no longer read the full terraform configuration, but instead will read the plan output. This will make it easier for users to use the tool and will also make it more efficient. The API will also be updated to support the new CLI tool.
Modernise the dashboard
The second step is to modernise the dashboard - The dashboard will be updated to suit a more modern design, primarily trying to improve the user experience but importantly removing features that are not related to the MVP. The charts will be made interactive, and the data will be presented in a way that is easy to understand. The authorization setup will also be updated to use OAuth2 instead of API keys.
Next
Now that there's a plan laid out next steps are to code. I'll write up another post detailing the changes I'm making and how I'm going to make them.